×
Technical Appendix
Underlying assumptions and data constraints are inherent in any projections and must be understood to determine the appropriate uses and interpretations of the projections. The historical reported counts and the projections of high school graduates in this edition of Knocking at the College Door rely on several types of data accumulated over many years and spanning more than three decades, from school year (SY) 2000-01 to 2036-37. The sections below provide an overview of the projection methodology, pertinent information relating to the data underlying the projections, and influential factors that are implicitly modeled in the projections. Of particular relevance for this edition are the possible implications for these projections of the COVID-19 period, which are referenced in this Technical Appendix and the main Knocking at the College Door report issued with the projections in December 2020.
Methodology Overview
WICHE’s Knocking at the College Door projections of high school graduates are produced using a methodology known as the cohort survival ratio (CSR) method, which is essentially an observation from the count data sources, of the progression of the number of students/individuals from birth to first grade, through each grade, and eventually from the 12th grade to high school graduates. WICHE uses these calculated ratios to project the number of enrollments and graduates in the years to come. WICHE uses a five-year smoothed average ratio for making the projections, in order to place relatively greater weight on the most recent year’s data without masking or eliminating any trends that would be evident by taking a longer view. Each cohort survival ratio is calculated as:

where Ypt is the CSR at a given progression point p in year t, and w is the smoothing weight (equal to 0.4 in the first year and .15 for each of the four prior years in WICHE’s methodology). In simple terms:
- The CSR methodology operates by calculating the difference between the enrollments in a given grade in one school year and the enrollments in the subsequent grade level the next year. For example, if there are 100 first graders in school year 2018-19 and 98 second graders in 2019-20, the ratio of first graders to second graders is 0.98. (Although the focus of this publication is on high school graduates, the CSR methodology also produces grade-level enrollment projections.)
- The ratio of 12th graders to graduates indicates the ratio between the reported count of 12th graders in a school year to the number of high school graduates (the graduate counts encompass all graduates throughout the school year, but largely reflect those who graduate in the spring term).
- WICHE also uses data on births from the National Center for Health Statistics (NCHS) to derive the ratio of the number of children born in a given year compared to the number of first graders reported approximately six years later, in order to extend the graduate projections beyond what can be projected from reported enrollments. Thereby, the last year for which graduates can be projected is 17-18 years past the last available year of births data, which is approximately when the most recently born children would be graduating from high school.
WICHE uses the CSR methodology for reasons similar to why educational planners in schools, school districts, states, and the federal government use it – because its relative simplicity and transparency meet the wide-ranging needs of its users. But perhaps an even greater strength of this methodology is that only a limited amount of data are required. Despite the relative simplicity of the CSR methodology, studies have shown that it is reasonably accurate for short-term projections and even for small populations.[1] While alternative methodologies exist that provide short-term projections that are as accurate as CSR, this equivalence is offset by the fact that the alternative methodologies have more extensive data requirements and employ techniques that are less easily understood by non-statisticians.[2]
Data Sources and Notes
This section provides specific information regarding the sources of data used in this publication, detailed notes and observations about the raw data, and any adjustments made to these data. For most state total graduates (public plus private schools), the public school portions are projected beginning SY 2019-20, while the private school portion is typically projected beginning SY 2017-18. Public school graduates comprise 85 percent or more of the total for the nation and 40 states. Therefore, for simplicity when writing about the projected public school graduates, or grand total of public and private schools, the first projected year of high school graduates is typically stated as SY 2019-20 (class of 2020).
For simplicity when writing about the projected trends, WICHE typically states SY 2019-20 (class of 2020) as the first projected year for high school graduates. But, some aggregated values include a projected portion.
When writing specifically about private school trends, the projections are described as beginning with SY 2017-18 (class of 2018). The nation and three of the region aggregated numbers also include a projected portion, because at least one states’ public school projections begin in an earlier year (Delaware, Nevada, and Vermont). Any exceptions to these typical projection starting years are documented in detail in the downloadable datasets, Appendix Table 1, and in charts and graphs, where feasible.
Public School Data
Enrollment data. All state-level public school enrollment count data used in the projections that are new to this edition were obtained from the Common Core of Data (CCD) public datafiles for State Nonfiscal Public Elementary/Secondary Education Survey Data, maintained by the National Center for Education Statistics (NCES), part of the U.S. Department of Education at https://nces.ed.gov/ccd/files.asp. At the time of publication, the most recent available CCD data were for grade-level fall headcounts through SY 2018-19. The CCD public school enrollments data for SY 2008-09 to 2013-14 were used and published in previous editions of Knocking at the College Door, but may not exactly match previously published values, because in previous editions WICHE “bridged” the data by race/ethnicity from the seven current reporting categories to five previous categories.
High school graduates data. Data for public school high school graduates for most years from SY 2002-03 to 2012-13 (class of 2003 to 2013) are also from the CCD public data files or as published in Digest of Education Statistics (at https://nces.ed.gov/programs/digest/), when not available through the public datasets. In early 2020, as it became clear that the CCD total annual graduate counts data would not become available in a timely nature for updating the projections, WICHE decided to collect the data for public high school graduates from SY 2013-14 to 2018-19, or the most recent year available, from state departments of education. The data were obtained from state websites, through requests for public information or from other advertised processes for data requests (sources are documented in Appendix Table 1).
WICHE took extensive care to obtain data that related to the definition of high school graduates that has been the foundation of these projections for most editions: the total number of graduates or completers in the school year who received a formal document certifying the successful completion of a prescribed secondary school program of study, including regular high school diplomas that are differentiated by type, such as an academic diploma, a general diploma, or a vocational diploma (for further related education data definitions see also https://www2.ed.gov/about/inits/ed/edfacts/sy-19-20-nonxml.html). Unless otherwise noted in Appendix Table 1, other state-recognized equivalents were not included in these counts, including recognized alternative standards for individuals with disabilities (also often referred to as “other completers”), or GED recipients.[3] In the cases where it was inconclusive which graduate types were included, the differences that we observed in the data were generally within 1-2% of public school graduates for the given state. While the requirements for high school graduation do vary by state, these data and the trends they depict are therefore, at least, descriptive of regular diploma recipients.
While the requirements for high school graduation do vary by state, these projections and the trends they depict are by and large representative of total annual standard high school diploma recipients.
Estimated total annual public graduate counts. For eight states, WICHE was not able to obtain specific counts of total annual public high school graduates from the state department of education, and WICHE had to compute estimates of total annual graduates instead; estimates were also used for a portion of public graduates for two other states (Table A-1). These estimates are made from data published by the respective states, about graduates within 4 to 7 years of their defined ninth grade cohort, for adjusted cohort graduation rate reporting. (Note: the state-published data typically provides more information about Adjusted Cohort Graduation Rate (ACGR) graduates than is available through EdFacts at https://www2.ed.gov/about/inits/ed/edfacts/sy-19-20-nonxml.html, which is limited to on-time graduates within four years of ninth grade and does not provide a direct count of graduates.) The data used for these estimates generally provided at least the number of on-time graduates, plus the information needed to compute graduates within 5, 6, or in selected cases, 7 years of ninth grade. WICHE did not have the data to precisely determine how different these estimates are, in number, from total annual graduates. Estimates that stop short of graduates within 7 years of ninth grade may be systematically different (lower) than a total annual number of graduates, by a small, but consistent amount. WICHE estimates that no more than 5 percent of the U.S. total derives from these states’ estimates, and it likely leads to less than 0.25% undercounting at the national level. Nonetheless, there may be issues with estimates produced from the publicly available cohort graduation data, because those data are not configured for such computations. WICHE carefully reviewed the computed estimates for consistency against available data for major obvious issues (e.g., graduate counts through SY 2012-13 and 12th grade counts through SY 2018-19 from NCES Common Core of Data). Detailed notes about each states’ estimates are in Appendix Table 1.
Table A-1. SY 2013-14 to SY 2018-19 Public High School Graduates Estimated from Adjusted Cohort Graduation Rate Data
| States with Estimated Data from ACGR | |||
| Arizona | District of Columbia | Delaware | Nebraska |
| New Mexico | Nevada | Vermont * | Washington |
* Vermont estimates were obtained from the New England Secondary School Consortium (NESSC), not computed by WICHE. NESSC estimates are also used for a portion of New Hampshire and Rhode Island’s graduates.
Suppression of small numbers of graduates. In relatively few cases graduate counts for a given public school race/ethnicity series were not available – and projections are therefore not made – because the number was suppressed in the source data to protect the privacy of very few students. In some cases, the unreported graduate counts for a particular race/ethnicity might be counted in another category of student. In these cases, it appears that the graduate counts that are not available for the given category are counted in the public school total. Also, by consequence, where Native Hawaiian/Other Pacific Islander graduates are suppressed, the combined Asian/Pacific Islander and the separate Asian categories are likely to have equivalent numbers of graduates. Because the region and nation graduate counts are derived from the sum of state counts, this suppression results in the aggregated projections being incomplete by an estimated very small amount (Table A-2). Appendix Table 1. provides specific detail for the states with suppressed values.
Table A-2. Estimate of U.S. Public High School Graduates Missing Due to Suppression, by Race
| American Indian/Alaska Native | Asian | Native Hawaiian/Other Pacific Islander | Two or More Races |
|
| States not reporting counts | 4 | 1 | 9 | 1 |
| Est. missing from U.S. graduate count | 0.1% | 0.0% | 0.1% | 0.0% |
Limited adjustments were made to reported data. WICHE carefully reviewed the data for anomalies and noted data nuances, but limited data adjustments to a very few cases in which there were obvious discrepancies (see Appendix Table 1 for specific detail). The data were reviewed with the expectation that there might be some perceptible effects of transitioning across race/ethnicity category schemas, as well as “real” but apparently erratic adjustments in number, especially for smaller counts. While potentially problematic for making projections, this type of anomaly was typically not considered a data error unless it was suggested by something such as an observed difference in the total public count compared to a sum of races/ethnicities.
Private School Data
The Private School Universe Survey (PSS) is the primary source of data for the private school projections. PSS is a biannual survey conducted in odd years by NCES and provides data for public use (at http://nces.ed.gov/surveys/pss) for religious and nonsectarian private/nonpublic elementary and secondary schools in the 50 states and the District of Columbia. Private school grade level enrollments or graduates are only intermittently available from states.[4] Private school enrollments for this edition came from the publicly available survey data files for SY 2013-14, 2015-16 and 2017-18. Enrollments for SY 2017-18 and high school graduates for SY 2016-17 (class of 2017) were the most recent data available at the time of publication.[5] Therefore, projections of private high school graduates for most states in this edition begin with SY 2017-18 (class of 2018), with exceptions as outlined below or noted in Appendix Table 1.
Because the PSS data are collected every other year, enrollment counts for grades 1 to 11 for years between PSS administrations are typically linearly imputed by WICHE after data review is completed. The exception is grade 12 enrollment counts, which are effectively provided in the PSS data for all years, because survey question 9b asks for the number of students enrolled in the 12th grade around October 1 of the prior academic year, which corresponds with the number of graduates reported for that same (prior) academic year.
Details concerning the PSS survey and data methodology are available on NCES’s Private School Universe Survey website (http://nces.ed.gov/surveys/pss). Of particular relevance—the survey frame list is composed of schools from several sources. The main source is information initially for the SY 1989-90 survey, which is updated every PSS cycle by matching it with lists provided by nationwide private school associations, state departments of education, and other national private school guides and sources. Additionally, an area frame search is conducted by the Census Bureau each survey cycle, to identify schools not included in the list frame and to compensate for the under-coverage of the list frame. Response rates for the PSS have generally been high: 92 percent for 2011-12; and then dropping to between 75.7 and 82.9 percent between 2013-14 and 2017-18 administrations. PSS applied weighting adjustments to eliminate some bias, because the 2015-16 and 2017-18 unweighted unit response rates were 75.7 and 81.4 percent, respectively (weighted response rates of 69.2 and 76.6 percent), and this is below NCES Statistical Standard 4-4 of 85 percent.
WICHE computed state-level weighted enrollment estimates from the PSS survey response data, as has historically been done for these projections. As described in the PSS documentation: “In surveys with complex sample designs, direct estimates of sampling errors that assume a simple random sample will typically underestimate the variability in the estimates. The PSS sample design and estimation included procedures that deviate from the assumption of simple random sampling, primarily resulting from the stratified cluster sampling occurring in the area frame. The preferred method of calculating sampling errors to reflect these aspects of the complex sample design of PSS is using replication.” So, WICHE used the 88 replicate weights provided with the response data to compute sampling errors; the estimates and sampling errors were computed in SPSS statistical software. WICHE computed the estimates and sampling error for the enrollments. But the state-level graduate estimates are only available as published by PSS, with the standard errors. The sampling error is expressed in terms of coefficients of variation (CV)—that is, the ratio of the sample standard deviation to the sample mean (enrollment estimate)—at a confidence interval of 90%. WICHE typically considers a coefficient of variation of 25% or less as acceptable for using survey-based estimates.
WICHE observed a higher frequency of unacceptably high sample error with the private school estimates than has been the case for previous editions. WICHE used statistical measures for evaluating the state-level private school estimates arising from the PSS data, but in practical terms, the estimates with higher standard error also generally evidenced anomalous patterns. WICHE applied the PSS program standards for estimates and suppressed estimates with CV greater than or equal to 50%, and carefully reviewed estimates with CV 30-50% to avoid projecting forward what might be considered data anomalies, to future years. Table A-3 summarizes states with grade-level or graduate estimates that WICHE had to suppress from use or adjust the methodology to avoid. In limited cases, WICHE made selected imputations for the problematic estimates. In most cases, modifications occurred with, and impacts, the starting projection year for enrollments. For only two states were graduate estimates suppressed and projections begun earlier than class of 2017 (Kentucky and Nebraska). For a limited number of states, the most recent year of available enrollment estimates, SY 2017-18, were not statistically acceptable and therefore projections were lagged to use the next most recent statistically acceptable estimates; therefore, some states’ private school enrollment projections will begin with SY 2015-16. For some states, progression ratios and/or enrollment estimates from earlier years were used, outside the years that would typically have been invoked for these projections (SY 2013-14 to 2017-18).
Table A-3. Adjustments for High Standard Error Estimates of Private School Students or Graduates
| States with Adjusted/Suppressed Grade-Level or Graduate Estimates | ||
| Delaware | District of Columbia | Idaho |
| Iowa | Kentucky | Louisiana |
| Michigan | Minnesota | Missouri |
| Nebraska | New Hampshire | New Mexico |
| Wisconsin | ||
Note: Appendix Table 2 summarizes all states’ grade-level estimates produced from the PSS data with coefficients of variation greater than 25 percent.
Practically speaking, the private school estimates indicate a notable amount of change for the private school sector since 2010, even after WICHE accounted for survey sampling error in the estimates. WICHE limited modifications to states with higher standard errors, allowing possible real changes in the sector to carry forward – whether or not such sustained change will be borne out by subsequently reported counts. Furthermore, the national and regional private school estimates are produced independently of the states and were not hampered by limitations in the state-level data. The exact state-by-state details of problematic estimates and adjustments are provided in the projection datasets and Appendix Table 1.
Grand Totals
Several details should be kept in mind for the grand totals of public and private schools.
The portion of the grand total that is private school graduates, is estimated. With the recent increase of survey sampling error in the private school data (see Private School Data), it is important to emphasize that the portion of the grand total that is from private schools are estimates, and conceivably less certain than the overwhelming portion that is driven by public school populations. In addition, the rapid and substantial trend shifts with private schools in recent years are not ideal for making projections. The progression methodology will mathematically carry forward recent past trends, even if the magnitude of change is not sustained in actuality over the coming 15-17 years. Also, the private school portion of the grand total is two years lagged from the public school portion (projections beginning SY 2017-18 and SY 2019-20, respectively), and data about COVID-19’s impacts on the private school sector will not be available as soon as with public sector data.
Publicly funded students attending private schools cannot be isolated in the data. WICHE is aware of some possible duplication in the public and private schools data relating to publicly funded students who attend private schools, because their towns do not have public schools. Data is generally not available to de-duplicate these students. This possible duplication applies to Vermont and Maine, at least.[6] For example, by WICHE estimates, Vermont’s total public and private graduate counts (and projections) might be overstated by up to 10 percent due to likely duplication of these students in the public and private school data (WICHE estimate from compiled data and correspondence with Vermont Student Assistance Commission).
The estimated additional number of American Indian graduates from Bureau of Indian Education schools is estimated for the nation only. As detailed in the section Considerations for the Race/Ethnicity Categories, WICHE provides a national-level estimate of the potential additional American Indian graduates who may arise from students from schools under the authority of Bureau of Indian Education (BIE) in this edition. However, WICHE has only estimated the contribution of BIE high school graduates nationally and these numbers are not included in any state estimates (see more in the section National Estimate of Total American Indian/Alaska Native Graduates from Public Schools and BIE Schools).
Births Data
WICHE obtained data for live births from the National Center for Health Statistics and Prevention, which is part of the Centers for Disease Control (CDC). The data were acquired through the CDC WONDER table builder at https://wonder.cdc.gov/natality.html, and from Vital Statistics Rapid Release Report No. 8 Births: Provisional Data for 2019.[7] Births data are grouped according to the mother’s state of residence, mother’s Hispanic origin, and mother’s race. For this edition, WICHE acquired births data for 2015 to 2019, and added them to births data used for previous editions. The latest available data were for total statewide births in 2019, and statewide births by race/ethnicity in 2018. Therefore, projections for the totals of public and private schools extend through SY 2036-37, whereas public school projections for most race/ethnicity categories extend to SY 2035-36. The births data are considered final, so generally, adjustments were not made to the values obtained. Important differences between the categorization of racial/ethnic identity in the natality and education data are discussed under Considerations for the Race/Ethnicity Categories, but no adjustments were made to the births data for the projections.
U.S. Outlying Areas and Territories
Puerto Rico. Puerto Rico public school enrollments are from the Common Core of Data (see Public School Data). The public school graduate counts for SY 2010-11 to SY 2018-19 were obtained by correspondence with El Instituto de Estadísticas de Puerto Rico (estadisticas.pr). There can be issues estimating Puerto Rico’s population trends since Hurricane Maria in 2017, let alone projecting it into the future.[8] WICHE limited the high school graduate projections to the years that could be produced by enrollment data. Even these limited projections indicate a 61% reduction of Puerto Rico public school graduates by 2030, which may be an implausibly large decrease depending on return migration between now and 2030. Only the public total high school graduates are projected, more than 99.5% of whom are categorized as Hispanic (any race), according to the data. No data were available for graduates of Puerto Rico private/nonpublic schools. But, data provided for the 9th edition of these projections indicated that possibly one-third of Puerto Rico high school graduates may be with private/nonpublic high schools (13,000 graduates of private/nonpublic schools, on average, between SY 2010-11 and 2013-14).
Puerto Rico is not added to the national (U.S.) data and projections (the U.S. is a sum of the 50 states and District of Columbia). Puerto Rico’s public high school graduates were 0.6% of the U.S. total public graduates in class of 2019, decreasing to a projected 0.3% by 2030; and 2.3% to 0.9% of U.S. Hispanic public school graduates, respectively. Florida is estimated to have received the largest amount of the out-migration after Hurricane Maria, followed by Texas, Pennsylvania and New York.[9] But WICHE did not have the data to estimate what portion of these state’s high school graduates may have recently migrated from Puerto Rico.[10] (Therefore, some amount of “boost,” possibly temporary, may be reflected in recipient states’ (Hispanic) high school graduate projections.)
WICHE members Guam and Commonwealth of the Northern Mariana Islands. Data were not available by the time of publication, to produce projections for WICHE members Guam and Commonwealth of the Northern Mariana Islands or to include them in the WICHE West region data.
An Estimated 3-4% of High School-Age Students are Home-schooled, but are Not Covered in WICHE’s Projections
WICHE knows users are interested in how home-schooled children add to the projected high school graduates — and at this particular time, home schooling has become even more relevant. So, WICHE researched recent past home-schooling trends to try to understand the extent of these students not being explicitly included in the data underlying the projections. In order to include home-schooled students in the annual graduate counts or produce a projection, WICHE would need detailed data disaggregated and not duplicated in other sources, about home-schooled students by grade level and the rate of students who complete a high school diploma.
WICHE’s research indicates home-schooled students are generally not covered by the source data that WICHE uses for the public and private school projections. Specifically, the primary data source for the projections, the NCES Common Core of Data describes all schools and students supported by public funding. The NCES Private School Universe Survey describes private schools not supported primarily by public funds, which provide classroom instruction with at least one teacher in a school; organizations or institutions that provide support for home schooling without offering classroom instruction for students are not included. However, the survey underlying these data does inquire about activities related to home schooling. On average between 2009-10 and 2017-18, 3.4 percent of private schools answered that “a major role of this school or program is to support home schooling,” and 0.6% of private schools responded that the “school or program located is in a private home that is used primarily as a family residence.” In neither case is there an estimate of the number of students associated with these specific activities.[11]
Importantly, even where one finds information/data, it only describes students. WICHE does not find information about the rate at which home-school students graduate or how many high school graduates were home-schooled. There is no single data source for home-schooled students across states, and there is wide variation in data collection by states. WICHE located two sources for state counts/estimates.[12] Both sources provided data for total enrollments (for some or all states), but not the detail for grade level or high school graduation needed for projections.
National estimates are available from the Parent and Family Involvement in Education (PFI) questionnaire of the National Household Education Survey (NHES).[13] School year 2015-2016 is the most recent for these data, which have only been provided approximately every four years. It is very possible that the home-schooling rate may increase in the immediate term during the COVID-19 period, but the data are not available in time for publication to shed light on these potential shifts (and, temporarily home-schooled children are not counted in the home-school estimates from the national statistics from NHES).[14] But, in 2016, almost four percent of 5- to 17-year-olds were home-schooled (3.8 percent, 1.7 million). This represented a doubling of home-schooled children from 1999 (0.9 million), and a stabilization through the highpoint in 2012 (3.4 percent). Those most likely to be home-schooled in 2016 were: Grades 9 to 12 (3.8 percent); White (3.8 percent) or Hispanic (3.5 percent); rural (4.4 percent); in the South (3.9 percent) or West (3.7 percent); in families with 3 or more children (4.7 percent); in two-parent households (3.7 percent), particularly those with (only) one parent in the labor force (7.2 percent); and near-poor households (4.7 percent).[15]
Considerations for the Race/Ethnicity Categories
For the first time, WICHE is producing projections disaggregated by the expanded set of seven racial/ethnic categories established by the Office of Management and Budget (OMB) in 1997, for public school students and graduates. The WICHE projection method relies on the availability of a minimum of five years’ worth of uniform data, and this accumulation of data is now largely available. Projections are now provided for public school students and graduates in these series:
- Hispanic or Latino (any race)
Among those not categorized as Hispanic or Latino:
- American Indian or Alaska Native
- Asian
- Black or African American
- Native Hawaiian or Other Pacific Islander
- White
- Two or more races (multiracial)
Ultimately, users should take note that there are subtle differences between the exact definitions of the race/ethnicity categorizations in any given year for the 30 years of retrospective and future data that this edition encompasses. Generally speaking, data for public school student and graduate race/ethnicity for SY 2010- 11 and all subsequent years reflect the categorizations according to the new protocol. But, data published with these projections for historical perspective, for years prior to SY 2010-11, overwhelmingly reflect the previous long-standing five racial/ethnic categories.[16] While it was possible to produce projections in this new schema, some remaining limitations with or considerations about these varying data sources remain relevant.
Nuances of the Births Data Used for the Extended Projections
Projections for 2030-31 to 2036-37 are not possible for all race/ethnicity categories. There is not yet the necessary overlap between the births and school data, to extend all the projections for all race categorizations past what can be projected from school enrollment numbers. State revisions to birth certificates to reflect the 1997 OMB standards for race/ethnicity were on different timeframes than education agencies. All states were required to report education data in the new race/ethnicity categorizations by school year 2010-11. Birth certificates were not fully converted across all states until 2014, and the first year of publicly available births data in the new race/ethnicity categorizations is 2016 (see https://wonder.cdc.gov/natality.html). But, the projection methodology would need births from 2012 and first grade enrollments from SY 2018-19 – and similarly matched quasi-cohorts for four prior years – to include births for the extended projections for all of the separate new race/ethnicity categories. These limitations should diminish by the next edition of these projections, but for now:
- Infants of Hispanic origin are categorized separately from non-Hispanic infants, and this category overlaps between the education and births data for making projections of public school Hispanic graduates through SY 2035-36. (Nonetheless, the quasi-cohort matching between the data sources is still imperfect, because births are categorized based only on the mother’s Hispanic identity).
- WICHE produces separate projections for public school non-Hispanic Asian graduates and Native Hawaiian/Other Pacific Islander graduates, only through SY 2029-30. The combined category of Asian/Pacific Islander is projected through SY 2025-36, since data by this category is similarly available from both births and school data.
- The births data do not support extended projections for multiracial non-Hispanic public school graduates; projections are only made through SY 2029-30. However, not having values for this series in the extended years would appear to make the total of public high school graduates when viewed by race/ethnicity, to be incomplete. Therefore, WICHE also issues approximations of the number of multiracial public high school graduates for SY 2030-31 to 2035-36 (this estimate is a simple continuation of their share of non-Hispanic graduates by SY 2029-30). However, users should understand that these approximate values should not be added with the other races/ethnicities in these outer years, because they would introduce some amount of inherent duplication.
- The births data for the remaining non-Hispanic race categories are provided in what is considered “bridged” race categories, which includes methodologically assigning infants of multi-race origins to a single category of White, Black/African American, American Indian/Alaska Native or Asian/Pacific Islander.[17] It is not ideal to continue using these “bridged” (multiple-race) births data with the now discrete single-race first grade enrollments data, but WICHE uses these data to produce the extended projections through SY 2035-36 in these categories.[18]
Other effects of births and school data differences. The projection method invokes recent births to project the number of first graders for 5-6 years after the last reported year of 1st grade enrollments. This is done using the five-year weighted average ratio of the number of first graders compared to infants born approximately six years prior, for the five most recent years. Theoretically, something very close to 100 percent of children born will enter first grade within six years, but WICHE observes ratios both above and below 100 percent. There could be many reasons why there might be more or less than 100 percent of infants appearing in first grade counts. The ratio of births to first graders has always been subject to some level of effect from interstate relocations, immigration, changes in race/ethnicity categories, early and late enrollment of first graders, home schooling and enrollment in private schools (which do not provide race/ethnicity detail), and the small but non-negligible rates of childhood mortality.
But in recent years, WICHE has observed increasingly disparate ratios of state births to first grade enrollments that we suspect relate to the known differences in race/ethnicity categorizations described above. For this reason and the limitations of the births data for making the extended projections, WICHE recently assessed the possibility of using another data source to model the longer-term projections. The primary alternative was population estimates by age and race/ethnicity from the U.S. Census Bureau American Community Survey (ACS) public use microsample data (PUMS). However, these data are not an equal substitute for the births data, for making the extended projections in the detail that WICHE produces the projections. The primary purpose for considering an alternative to births data was to gain precision with the state-level progression ratios by student race/ethnicity. But it was only possible to produce fewer than half of the necessary single-year age estimates by race/ethnicity by state, due to depletion from standard error (it was a similar case for multiple year age estimates, e.g., combined 5- 6-year-olds). Also, due to the nature of the ongoing ACS data collection, it is not possible to construct an equivalent definition of single-year age estimates in a given annual period that corresponds with school year, similar to what is anticipated with the progression methodology (e.g., micro age estimates are produced from ACS “5-year” datasets). (These data are used for other similar projections, which demonstrate the limitations and benefits of the data for various geographic groupings).[19]
Lacking a substitute for the births data for the extended projections, WICHE carefully reviewed the projections for SY 2030-31 to 2036-37 for overt over- or under-estimation of underlying population changes, but generally did not alter or restrict the projections. Possible inflation/deflation is most likely or apparent with smaller states and race/ethnicities.
National Estimate of Total American Indian/Alaska Native Graduates from Public Schools and BIE Schools
WICHE did not find the precise data needed to fully account for the additional number of American Indian graduates there would be, if students from Bureau of Indian Education (BIE) schools were accounted for, but estimated it in a supplemental series in the U.S. (national) data by this method[20]:
- WICHE used the U.S. total of grades 1 to 12 students covered by BIE schools, available from the U.S. Department of Education Common Core of Data for SY 2008-09 to 2010-11 and SY 2016-17 to 2018-19.
- From this, WICHE estimated the number of students for the intervening years.
- Because the number of high school graduates from BIE schools was not available, WICHE computed the number as a percentage of 12th grade students with BIE schools, using the rate of progression from 12th grade to graduation observed with (single-race non-Hispanic) American Indian/Alaska Native students in U.S. public schools.
- WICHE then computed the supplemental projections for combined total American Indian/Alaska Native graduates of public schools, plus the estimated number from students of BIE schools, nationally.
WICHE presents these supplemental estimates in the national data, to partially address some of the issues in the American Indian/Alaska Native projections series. Because specific graduation patterns vary across the states, this U.S. estimate may not describe the possible range of additional American Indian graduates that might be available from BIE schools located within specific states’ geographic boundaries. There are 187 BIE schools within the geographic boundaries of 23 states. And, when considered by the physical location of BIE schools within state boundaries, eight states encompass 88 percent of all students reported at BIE schools between SY 2016-17 and 2018-19. These same states encompass an average of 82 percent of grades 9 to 12 high school students at BIE schools (Table A-4).
Table A-4. Distribution of Students at Bureau of Indian Education Schools, SY 2016-17 to 2018-19, by State Boundaries
| Grades 1 to 8 | Grades 9 to 12 | Total Grades 1 to 12 | |
| Arizona | 30% | 14% | 26% |
| New Mexico | 21% | 16% | 20% |
| South Dakota | 15% | 24% | 18% |
| North Dakota | 10% | 8% | 10% |
| Mississippi | 5% | 5% | 5% |
| Washington | 4% | 6% | 5% |
| North Carolina | 2% | 3% | 3% |
| Oklahoma | 1% | 7% | 3% |
| Other states | 10% | 18% | 12% |
Note: By number of students, the other states with BIE students are: Minnesota, Michigan, California, Oregon, Montana, Maine, Florida, Wyoming, Idaho, Utah, Nevada, Iowa, Louisiana, and Kansas.
For the time being, WICHE has only estimated the contribution of BIE high school graduates nationally, and has not yet issued estimates of how graduates from BIE schools within specific states’ geographic boundaries may add to individual states’ total number of American Indian/Alaska Native graduates. Moreover, total possible American Indian/Alaska Native graduates remain not well represented by the available data, such as discussed in the full report of these projections.
Other Impacts of Race/Ethnicity Categorizations
Black non-Hispanic. The impact and nuances in the race/ethnicity categories are more visible in data that retain and report detailed individual-level data, such as the United States Census. For example, the 2015 Census population estimates indicate that there were 14 percent fewer individuals considered Black by the narrowest racial/ethnic categorization (non-Hispanic single-race Black, which is how Federal education data are reported) than the number considered Black using the less narrow categorizations of “Black only” or “Black in combination with another race”.[21]
White non-Hispanic. On the other hand, the single-race White category is also subject to definitional nuances. For example, Middle Eastern and North African individuals are captured under the White category, and notwithstanding the mandate to capture students in the mandated categories, families/students may indicate themselves as Hispanic or White differently over time.[22]
Private school graduates. Finally, the data source for private schools only provides the total number of K-12 students by race/ethnicity, and not detail by grade-level or for graduates. But, for example, NCES estimates that 67 percent of private elementary and secondary school students in fall 2017 were White.[23] But, WICHE is not able to estimate or project the additional graduates from private schools that would add to the race/ethnicity series.
Projection Accuracy
WICHE endeavors to ensure that the Knocking at the College Door methodology remains a credible and reliable method for producing these projections. This includes consulting with experts for each edition, assessing the accuracy of the projections against the subsequently reported actual data and other education projections, and carefully inspecting the underlying data and other pertinent information. Furthermore, WICHE releases updated projections every four to five years on average. This is a relatively short period of time considering that student populations and trends are relatively stable and the projections are therefore reliably contemporaneous.
Ongoing Review of the Methodology
WICHE has twice comprehensively reviewed the reliability of the methodology, in 1993 and 2012. The report from the 2012 methodological review remains relevant and is summarized in a report covering the commissioned technical white paper, a simulations analysis to compare the relative accuracy of several CSR alternatives, and two expert review panels — both a technical review panel of experts and an end-user panel of various experts who use Knocking at the College Door.[24] In the 2012 review, the CSR methodology was found to produce projections as well as or better than the two most feasible existing alternatives (single and double exponential smoothing), to accommodate the constraints of the available data, and to provide the transparency and understandability that give the projections their substantial credibility. WICHE will continue to assess methodological approaches as the data justify another review.
For this edition of Knocking at the College Door, WICHE consulted selected experts and stakeholders regarding some nuances of the data and base projections that were new or different than in prior editions of these projections:
Patrese Atine, director, congressional and federal relations, American Indian Higher Education Consortium, and Regina Sievert, executive director, innovation and research
Stephen Broughman, statistician, National Center for Educational Statistics
Jinghong Cai, senior research analyst, National School Boards Association
Sunny Deye, program director, postsecondary education, National Conference of State Legislatures
Eric Godin, associate vice president, State Higher Education Executive Officers Association
Amy Goldstein, associate vice president, organizational advancement, Thurgood Marshall College Fund
Christina Gordon, senior director, American College Testing, and colleagues
Nathan Grawe, professor, economics, Carleton College
Annie Holmes, chief equity officer, Council of Chief State School Officers
Jessica Howell, vice president, research, College Board, and colleagues
Darlena Jones, director, assessment and research, Association for Institutional Research
Julie Laurel, senior researcher, Excelencia in Education
Nancy Lewin, program director, ACT’s Center for Equity Learning
Michael Reilly, executive director, American Association of Collegiate Registrars and Admissions Officers
Doug Shapiro, vice president, research, executive director, research center, National Student Clearinghouse
Mean Absolute Percentage Error
WICHE analyzed the relative accuracy of the Knocking at the College Door projections at different periods of time for as many editions as possible through the last (9th) edition, compared to the compiled reported actual graduate counts. The mean absolute percentage error is one way to express the forecast accuracy of past projections, summarizing the differences between past projections and actual data.[25] The mean absolute percentage errors for WICHE’s projections of public high school graduates in the United States for lead times of 1, 2, 5, and 10 years were 1.5, 2.0, 3.2, and 5.4 percent, respectively, over these nine editions of the projections (Table A-5).
Table A-5. Mean Absolute Percentage Errors, Selected Lead Time in Years
| 1st Year Projected | 2nd Year | 5th Year | 10th Year | |
| National Projections | ||||
| Total public & private | 1.4% | 1.7% | 3.9% | 6.2% |
| Public schools | 1.5% | 2.0% | 3.2% | 5.4% |
| Private schools | 1.7% | 9.2% | 8.9% | 14.7% |
| State-Level Projections | ||||
| Total public & private | 2.2% | 2.7% | 5.4% | 9.5% |
| Public schools | 2.6% | 3.2% | 5.5% | 9.6% |
| Private schools | 8.5% | 13.2% | 19.0% | 30.0% |
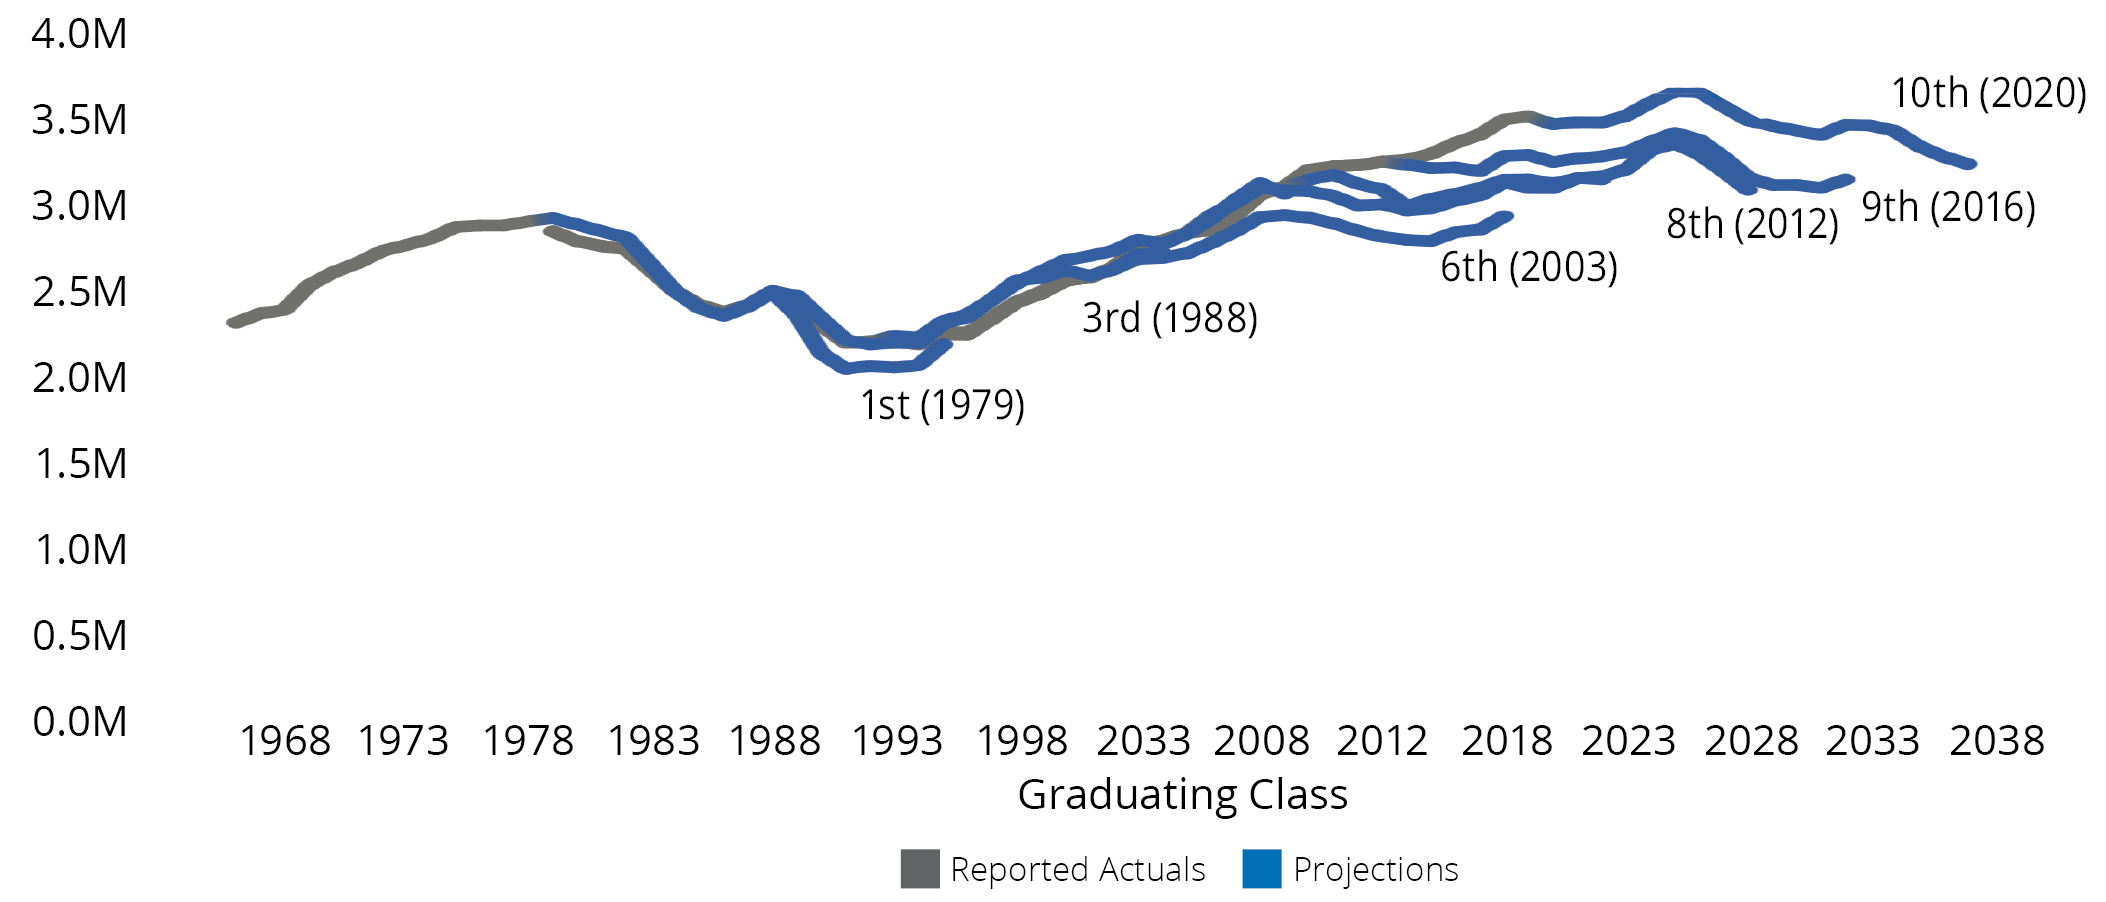
Figure A-1. Over Time: The Projections Track Reported Graduates (Public high school graduate projections from nine editions of Knocking at the College Door, 1979 to 2016) Figure A-1 illustrates how the projections have compared to subsequently reported public high school graduates.
There is greater variance for some regions and states, but it does not appear to be systematic or, systematically related to the methodology. Private school projections have been less accurate, with MAPEs of 1.7, 9.2, 8.9 and 14.7 percent for lead times of 1, 2, 5, and 10 years, respectively. The private school projections derive from survey estimates for the sector, not confirmed counts as for the public school series. And, more recent survey estimates are then used to evaluate the accuracy of the projections. It is relevant, therefore, that sampling error associated with these survey data has increased in recent years (see Data Sources and Notes). However, the majority of private school estimates had acceptable sampling error levels (CV <25%), and therefore WICHE used them for the MAPES analysis.
WICHE has been producing state-level projections of public school graduates by race/ethnicity since 1996, leading to roughly 20 years of projections by student race/ethnicity. For a number of reasons, it is difficult to quantify the projections’ accuracy over time by race/ethnicity. There have been substantial definitional nuances and changes with the underlying data over these two decades, both within data sources that are used in more than one edition, and as WICHE has had to use other data sources as data availability changed. And, WICHE had to continue producing the race/ethnicity projections with five major race/ethnicity categories for two editions during the period when the actual student data were reported in seven categories (due to data limitations). Finally, the births data, which predict the outer six years of each edition, are reported in roughly equivalent but not identical race/ethnicity categories as education data. All of this leads to expected imprecision between the projected numbers of high school graduates by race/ethnicity, and the ultimately reported number.
Comparison to Other Education Data
The MAPE analysis will be to some extent somewhat self-referential, because it does not include comparable data about the number of high school graduates independent of the data that underlie the projections. It can therefore be difficult to precisely attribute differences to the projection methodology, rather than differences arising from, for example, data definitions or reliability of survey estimates.
But, one point of comparison are the U.S. Department of Education’s published projections. While NCES uses a different cohort progression methodology (single exponential), the most recent NCES projections published in May 2020 are within 1.5 percentage points of the reported graduates for SY 2013-14 to 2018-19 provided with these data, and the projections past 2018-19.[26] This is perhaps noteworthy since the WICHE data sources depart from the NCES Common Core of Data source, but still confirms similar trends.[27] Of note, the NCES projections rely on the same private school survey estimates and demonstrated relatively high mean absolute percentage errors in the editions invoking data from SY 2010-11 to 2015-16; and similarly under-projected private high school graduates in a previous 43rd edition of projections that corresponded with WICHE’s 9th edition of Knocking at the College Door.[28]
Another point of comparison come from projections of college demand published by Dr. Nathan Grawe in 2017.[29] Dr. Grawe’s higher education demand index projections rely on different data sources and methodology. But, Dr. Grawe’s projections of 18-year-olds predicted to enroll in college depict similar patterns and relative numbers as WICHE’s high school graduate projections.
Expected Differences between National, Regional, and Subgroup Projections
WICHE makes lower-level projections independent of the aggregate projections. The primary reason for this is to let possibly legitimate growth trends that are seen at the lower levels be evident; they might be overstated or understated if they were adjusted. The small numerical differences that result from making these projections independently may cause confusion for some users of these projections. Generally speaking, the differences between the independently projected series tend to increase in later future years, consistent with the nature of extended projections. And these differences are expected to be more evident in series with smaller numbers.
National and regional projections are made independently of state projections. The state projections do not equal exactly to the regional projections, nor do the state and regional projections sum exactly to the national projections.
- The sum of WICHE’s state-level projections is about 19,000 total graduates (0.54 percent) greater than that of the independent projection for the United States by 2036-37, the last year projected for total high school graduates (and generally lower percentage difference in prior years).
- There is less than one percent (1 percent) difference between the sum of states and the regional projections for all four major geographic regions, except for the private school projections in the South region, which shows up to a 6.7 percent difference between the sum of states and region projections by class of 2036.
Each public school race/ethnicity category is projected independently, by state. Those projections do not necessarily sum to the regional or national total public projections. And the sum of the independently projected race/ethnicity series do not necessarily sum to the public school total.
- The maximum differences observed in the sum of state’s race/ethnicity projections compared to the national projection for that race/ethnicity, is 3.5 percent, which occurs with the American Indian/Alaska Native and Asian/Pacific Islander series by 2036.
- On average, the state-level sum of races/ethnicities is 2.9 percent less than the state public school total projection, or a lower percentage difference, in any year.
- A difference can be expected between the sum of races/ethnicities and the public total in states with suppression in any of the race/ethnicity categories. In these states, the sum of races/ethnicities is .25% lower than the public school projections in 2019, and an average of 3 to 4 percent lower after 2030.
Implicit and Environmental Influences on the Projections
Demographic studies generally identify two main sources of population change: natural increase and net migration.[30] The number of school-age youth – and, eventually, high school graduates – is influenced first and foremost by the number of children born, and secondarily by factors such as grade retention and acceleration, net migration between states and school sectors, dropouts, early graduations, mortality, and major events, policies and practices.
The cohort survival ratios that are used to generate the projections capture these factors, implicitly through the recent past counts of infants, students and graduates, and carry them forward into the future projected years. However, this assumption has the greatest potential to degrade the accuracy of the projections should either a new pattern emerge in the preceding year or two, or new circumstances emerge in reality that are not evident in the years of available data.
The Number of Infants Born is a Key Predictor of Future Numbers of Graduates
The projections methodology models change in birth trends explicitly, while assuming that the implicit influences on enrollments and graduates will carry forward indefinitely. Under the current methodology, Knocking at the College Door estimates the number of first graders based on the number of births that occurred six years prior. WICHE obtains data for live births by state and race/ethnicity from the National Center for Health Statistics, which is part of the Centers for Disease Control and Prevention (see Data Sources and Notes). Births for 2019, in total, and for 2018 by race/ethnicity, were the latest available data at the time of publication. This establishes the last year for total public and private high school graduate projections as 2036-37 – that is, approximately when babies born in 2019 would reach 17 or 18 years of age (approximately, because births are reported for calendar years January to December, while enrollments are reported for school years and therefore do not overlap precisely). While not the principal focus of this publication, birth trends are instructive in their own right because of the significance they play in the projection methodology.
The United States experienced a new high number of 4.32 million births in 2007. There have been consistent annual declines in U.S. annual births (about 1 percent annually) since that high point in 2007. There were 3.7 million U.S. births in 2019 – 13 percent fewer babies born than in 2007. Therefore, these successively smaller birth cohorts started transitioning into elementary schools by school year 2013-14 and are now moving through the elementary grades, and the infants born in 2014 will recently have started school. Following from this, the predicted smaller classes of 2026 to 2030 are reflective of declining student numbers now progressing through elementary schools, and graduating classes past that point are predicted to be smaller in number corresponding to recent births.
Mortality, Grade Retention, and Grade Acceleration
Mortality, grade retention (holding students back), and grade acceleration (promoting students early) impact enrollments and grade progression to varying extents. More importantly, national estimates indicate that these factors can vary systematically by race/ ethnicity.[31] However, these data cannot be specifically derived in the detail needed to explicitly model the detailed projections by state, race/ethnicity and grade level. Instead, they are implicitly included in the calculated cohort survival ratios that reflect the various aspects of grade progression. Interested readers can find more detail about child mortality, grade retention, and grade acceleration in WICHE’s 2012 Methodology Review Report.[32]
Movement and Migration
The impact of movement and migration may have an impact on year-to-year enrollment data and ratios. One type of movement is when students transition between public and private schools, which most typically occurs at the junctures between school levels (e.g., when parents shift their children from public to private school at the beginning of ninth grade). The movement between public and private schools is implicitly reflected in the data for public and private school enrollments, but they are not easily discernible from other factors that are in play at the same time (e.g., relatively high rates of retention in the ninth grade), because they typically occur in relatively small numbers compared to the totals.
Migration between states also accounts for some difference between the number of eventually reported graduates, and the number projected. (Of course, intrastate movements might occur even more frequently than cross-state movements, but state-level and more aggregated projections should be affected only by cross-state or international movements.) WICHE is not able to explicitly model migration’s specific impact in these detailed projections. Rather, one typically observes patterns with school populations that coincide with migration retrospectively.
WICHE has documented in previous editions, the relative patterns of immigration that may bear on high school graduate trends. Immigration and non-native populations have been important factors in the overall size and profile of the U.S. population and school-age youth. They may be increasingly important as the number of White students continues to decline, and as the domestic U.S. youth population contracts with the ensuing birth declines. In-migration to the U.S. contributes positively to the number of the U.S. high school graduates. Relatively lesser migration of school-age children is usually not discernible in immediate trends. The greater potential contribution may be from infants born to non-native families/parents, the impact of which will not be evident until approximately 18 years after a given immigration period.[33] But, in the years that matter for the span of projections in this edition, immigration to the U.S. has been down, historically speaking.[34] Nonetheless, some states may have been recipients to larger portions of the overall immigration, and their projections may be more impacted (see Economic and External Factors).
These Graduate Data are Not Computed from Graduation Rates, but Do Numerically Track the Rates
As described under Methodology Overview, the data WICHE uses and the resulting projections are of total annual high school graduates. The projections are not computed from any specific graduation rate (averaged freshmen graduation rate or adjusted cohort graduation rate). But, for this edition, WICHE did access information about the adjusted cohort graduation rates, for certain analyses.
In selected cases where WICHE could not obtain the total annual public high school graduate counts from a state, WICHE computed an estimate of graduates within four to seven years of an assigned ninth grade cohort, from data published by the state about their adjusted cohort graduation rates (see Data Sources and Notes).
WICHE also accessed data about national adjusted cohort graduation rates, and for states, from the U.S. Department of Education (available at https://www2.ed.gov/about/inits/ed/edfacts/data-files/index.html). Graduate counts are not provided in these data files, so to estimate the state-level number of on-time graduates (public schools total), WICHE applied the state-level graduation rate to a computed estimate of the state ninth-grade cohort, which must be compiled from district-level data. This state-level estimate will represent only those who graduated within four years of their assigned ninth grade cohort. Appendix Table 3 provides a comparison of the changes in the number of total annual public high school graduates, estimated on-time graduates, and on-time graduation rates, from SY 2012-13 to 2017-18 (the most recent available on-time graduate data). This analysis indicates that the number of total annual high school graduates strongly reflects so-called “on-time” graduate trends.
Natural Disasters
There have been several extraordinary hurricane events in the past several years. In 2017, three major hurricanes (Harvey, Irma and Maria) struck Texas, Florida and Puerto Rico, respectively. A year later, Michael became the first Category 5 hurricane to hit the contiguous United States since 1992, impacting Florida’s Gulf Coast in particular. These events inevitably disrupted students’ education and led to migration within and across state lines. For example, Florida signed supplemental orders waiving school-entry documentation requirements, allowing students displaced by these storms to attend any Florida public schools.[35] After Hurricane Maria displaced students from Puerto Rico, Florida Department of Education signed a waiver allowing high school juniors and seniors the option of earning a Puerto Rico high school diploma from the Florida high school they are attending while displaced.[36] However, WICHE did not find specific data to isolate these students by state, or their potential impact in the projections.
Wildfire season in the American West is growing longer and more intense each year, but WICHE found no evidence that major wildfire seasons in the West through 2019 impacted migration and schooling.
High School Graduation Exams and Standards
Changes in high school exit examinations or standards might be evidenced in changing numbers of high school graduates (although there are typically not data to directly isolate this). As of 2019, 47 states and the District of Columbia have adopted statewide high school graduation requirements while three states leave the decision-making to local levels. A notable example is that the California High School Exit Examination (CAHSEE) was eliminated due to a misalignment of the test and the Common Core standards. Beginning January 1, 2016, no student in the state of California is required to take an exit examination, including those in adult education courses. Furthermore, any student whose only outstanding graduation requirement was the passing of CAHSEE became immediately eligible to receive their high school diploma. By one estimate, this had the potential to affect about 249,000 students who had failed the test since it became a graduation requirement in 2006 (about 6 percent of the test takers in that time).[37] Since 2015, California has allowed any student who failed the exam to earn their diploma retroactively as long as they met all other graduation requirements.[38]
Educational Policies and Practices
Other changes may be evidenced in number and trend changes with high school graduates less directly or over the longer term. Here are several possible examples that relate to the time period that influences this edition of projections.
Dual and Concurrent Enrollment Opportunities, ongoing. Dual and concurrent enrollment opportunities continue to grow; as of 2019, all 50 states and the District of Columbia have a statewide dual/concurrent enrollment policy in place.[39] These policies may be providing an incentive to remain in school and may have some role in how long it takes students to complete high school.[40] At least one state (Colorado) includes potential high school graduates who choose to stay enrolled in high school for a fifth year in their graduation rate data so that they can participate in concurrent enrollment opportunities.[41]
Common Core Standards, 2010-present. In the early 2010s, states began adopting a common set of state standards as a way to improve math and literacy in K-12 education. The Center on Standards, Alignment, Instruction, and Learning found that many states that had adopted the Common Core lagged behind their peers that had not: “by 2017 — seven years after most states had adopted them — the standards appear to have led to modest declines in fourth-grade reading and eighth-grade math scores.”[42] Many states have begun moving away from the Common Core as evidenced by the decline in state participation in related assessments.[43] States participating in exams such as PARCC and Smarter Balanced have dropped from 23 in 2014 to just 16 in 2019. In 2011, 45 states had initially indicated they planned to use these tests.
The Deferred Action for Childhood Arrivals (DACA) program. As it relates to these projections of high school graduates, DACA was a possible factor during the period covered by the data, specifically, an incentive to remain in school. But no specific data exist to precisely analyze or quantify this. According to Migration Policy Institute estimates, in 2019, 680,000 individuals were in the DACA program, 98,000 undocumented students graduate from high school each year, 17 percent of which graduate from high schools in Texas and 27 percent from high schools in California.[44] DACA availability was constrained since 2017 as the Trump administration has sought to terminate the DACA program, and future availability may be affected by the 2021 U.S. presidential transition.[45] Even less certain is how the youth communities who are the focus of DACA will be impacted by the COVID-19 period, and how that might impact their contributions to the number of high school graduates.
Every Student Succeeds Act (ESSA), 2017-present. Beginning in 2017, every state and the District of Columbia are required to submit a school accountability, funding, and reporting plan to the Department of Education in compliance with the Every Student Succeeds Act (ESSA).[46] School districts receive funding from ESSA to support low-income students; federal dollars from ESSA are intended to supplement local budgets rather than replace them. Theoretically, ESSA could influence funding allocations in a way that begins shifting more funding to schools with higher relative proportions of students below the poverty line (among other ESSA innovations that might impact student achievement). Evidence will continue to emerge as ESSA is implemented, but there is evidence of funding inequities.[47]
529 Plans Available for Private School Tuition, 2017-2020. The Trump administration has been focused on school choice since 2017. The Tax Cuts and Jobs Act, passed in 2017, authorized 529 savings accounts to pay for K-12 private school tuition.[48] Whether this use of 529s influences the number of private school student is still emerging, but is so far estimated to be marginal and more likely utilized by families already choosing private school. Others point out that the potential impact is limited to families who know about or have a 529 account.[49]
Monitoring and Metrics. Finally, it is possible that more accurate student tracking through the increasing use of state longitudinal data systems may explain some numerically perceptible effects in the data underlying these projections — specifically, better tracking that leads to numeric changes in the data may be detectable by the methodology, but not be able to be isolated from other real change. Even more direct to these projections, the uniform official graduation rate may have had some effect on the number and type of diplomas awarded and counted in the data used for these projections.[50]
Endnotes
[1] Richard S. Grip, “Projecting Enrollment in Rural Schools: A Study of Three Vermont School Districts,” Journal of Research in Rural Education 19, 3 (November 2004), 1-6. See also Robert C. Shaw, “Enrollment Forecasting: What Works Best?” NASSP Bulletin 68, 468 (January 1984), 52-58.
[2] William J. Hussar and Tabitha M. Bailey, Projections of Education Statistics to 2028, Washington, D.C.: National Center for Education Statistics, May 2020, accessed on November 23, 2020, https://nces.ed.gov/pubs2020/2020024.pdf. Specifically, “Appendix A: Introduction to Projection Methodology”.
[3] Recipients of national high school equivalency assessments are not included in the data for high school graduates (except for a specific state or two, where it was noted as indeterminate in the data obtained from states). Detailed data are not available at the national or state level to fully account for these individuals, particularly what portion of them are typical high school age. But it appears that somewhere between 20 to 25 percent of the roughly 55,000 or more individuals who passed the TASC or HiSET versions of high school equivalency exams in years between 2015 and 2019, were between 16 and 18 years old. Recent estimates were not available for General Educational Development (GED) exams.
[4] The Every Student Succeeds Act (ESSA) requires local educational agencies (LEAs) to provide equitable participation to eligible private school children, teachers, and other educational personnel in programs under Title I Part A, Title II Part A, Title III Part A, and Title IV Part A (20 U.S.C. §§ 6320(b) and 7881(d)). WICHE notes that this presumes states are able to know the number of students enrolled in private schools. WICHE will continue to monitor for alternative sources of private school data.
[5] Specifically, enrollments come from the public datasets and graduates come from U.S. Department of Education, National Center for Education Statistics, Private School Survey Data (PSS) Table 15, which details the number of private schools, students, full-time equivalent teachers, and high school graduates, by state and academic year, both available on the PSS website at https://nces.ed.gov/surveys/pss/.
[6]Town and Unified Union School Districts Tuitioning List, State of Vermont, Agency of Education, August 26, 2016, accessed on December 7, 2020, https://education.vermont.gov/sites/aoe/files/documents/edu-data-town-district-tuitioning-list.pdf. EdChoice, “Maine – Town Tuitioning Program,” accessed on December 7, 2020 https://www.edchoice.org/school-choice/programs/maine-town-tuitioning-program/.
[7] Brady E. Hamilton, Joyce A. Martin, and Michelle J.K. Osterman, “Vital Statistics Rapid Release Report No. 8 Births: Provisional Data for 2019,” Division of Vital Statistics, National Center for Health Statistics, May 2020, accessed on November 23, 2020, https://www.cdc.gov/nchs/data/vsrr/vsrr-8-508.pdf.
[8] Jason Schachter and Antonio Bruce, “Revising Methods to Better Reflect the Impact of Disaster,” Washington, D.C.: United States Census Bureau, August 2020, accessed on November 23, 2020, https://www.census.gov/library/stories/2020/08/estimating-puerto-rico-population-after-hurricane-maria.html.
[9] Edwin Meléndez and Jennifer Hinojosa, “Estimates of Post-Hurricane Maria Exodus from Puerto Rico,” New York, N.Y.: Center for Puerto Rican Studies, October 2017, accessed on November 23, 2020, https://centropr.hunter.cuny.edu/sites/default/files/RB2017-01-POST-MARIA%20EXODUS_V3.pdf. Brian Glassman, “A Third of Movers From Puerto Rico to the Mainland United States Relocated to Florida in 2018,” Washington, D.C.: United States Census Bureau, September 26, 2019, accessed on November 23, 2020, https://www.census.gov/library/stories/2019/09/puerto-rico-outmigration-increases-poverty-declines.html.
[10] Catherine Gewertz, “Florida Clears Way to Diplomas for Hurricane-Displaced Students,” Education Week, January 3, 2018, accessed on November 23, 2020, https://blogs.edweek.org/edweek/high_school_and_beyond/2018/01/florida_clears_way_to_diplomas_for_hurricane-displaced_students.html.
[11] U.S. Department of Education, National Center for Education Statistics, Private School Universe Survey, Data and Documentation at https://nces.ed.gov/surveys/pss/.
[12] International Center for Home Education Research, “U.S. Enrollment Data,” accessed December 7, 2020, http://icher.org/endata.html. “Homeschooling by the Numbers,” Roxbury, Mass.: Coalition for Responsible Home Education, November 2017, accessed on November 23, 2020, https://responsiblehomeschooling.org/research/summaries/homeschooling-numbers/.
[13] Ke Wang, Amy Rathebun, and Lauren Musu, School Choice in the United States: 2019, Washington, D.C.: United States Department of Education, National Center for Education Statistics, September 2019, accessed on November 23, 2020, https://nces.ed.gov/pubsearch/pubsinfo.asp?pubid=2019106.
[14] “Back to School Survey Shows 47% of Parents Considering Dropping School, Going to Homeschooling.” Business Wire, July 9, 2020, accessed on November 23, 2020, https://www.businesswire.com/news/home/20200709005777/en/Back-to-School-Survey-Shows-47-of-Parents-Considering-Dropping-School-Going-to-Homeschooling. John P. Bailey, “Parents and the pandemic: A comprehensive analysis of survey data,” Washington, D.C.: American Enterprise Institute, June 2020, accessed December 7, 2020, https://www.aei.org/research-products/report/parents-and-the-pandemic-a-comprehensive-analysis-of-survey-data/.
[15] Detailed data are from U.S. Department of Education, Digest of Education Statistics 2017, Table 206.10, at https://nces.ed.gov/pubs2018/2018070.pdf.
[16] All references to students by race/ethnicity refer to public school students only. A small number of states began reporting in the new seven categories in school year 2008-09 or 2009-10. These distinctions are detailed in the published projections data and are most evident when looking at the data at a state level; they are not as apparent or feasible to isolate in regional and national views of the data.
[17] United States Department of Health and Human Services, United States Census 2000 Population With Bridged Race Categories, Hyattsville, Md: Vital and Health Statistics Series 2, Number 135, September 2003, accessed on November 24, 2020, https://www.cdc.gov/nchs/data/series/sr_02/sr02_135.pdf.
[18] For example, bridged-Race Population Estimates from 1990 to 2015 suggest that there has not been a net decline in individuals with Black origins, even though in some cases the projections indicate some decline, net of the recent birth declines. U.S. Department of Health and Human Services, Centers for Disease Control and Prevention, National Center for Health Statistics, “Bridged-Race Population Estimates,” available on CDC WONDER Online Database, accessed August 25, 2016, http://wonder.cdc.gov/bridged-race-v2015.html. On a related note, in recent years race/ethnicity was “not stated” for between 0.6 percent and 0.9 percent of births. So in the extended projections, the totals reflect all births, but these uncategorized births are not counted in any race/ethnicity category.
[19] Nathan D. Grawe, Demographics and the Demand for Higher Education, Baltimore, Md.: Johns Hopkins University Press, 2018.
[20] United States Department of the Interior, “Bureau of Indian Education: Schools,”accessed on November 24, 2020 https://www.bie.edu/schools/directory.
[21] Centers for Disease Control and Prevention, Bridged-Race Population Estimates, accessed November 5, 2020, https://wonder.cdc.gov/bridged-race-population.html.
[22] See for example: D’Vera Cohn, “Millions of Americans changed their racial or ethnic identity from one census to the next,” Pew Research Center, May 5, 2014, accessed October 1, 2016, http://www.pewresearch.org/fact-tank/2014/05/05/millions-of-americans-changed-their-racial-or-ethnic-identity-from-one-census-to-the-next/. Brian Duncan and Stephen J. Trejo, “The Complexity of Immigrant Generations: Implications for Assessing the Socioeconomic Integration of Hispanics and Asians,” ILR Review 70, 5 (October, 2017), 1146-1175. Gary D. Sandefur, Mary E. Campbell, and Jennifer Eggerling-Boeck, “Racial and Ethnic Identification, Official Classifications, and Health Disparities,” In Critical Perspectives on Racial and Ethnic Differences in Health in Late Life, Washington, D.C.: National Academies Press, 2004, accessed 17 October 2016, https://www.ncbi.nlm.nih.gov/books/NBK25522/.
[23] National Center for Education Statistics, “Private School Enrollment,” May 2020, accessed on November 24, 2020, https://nces.ed.gov/programs/coe/indicator_cgc.asp.
[24] Peace Bransberger, “Knocking at the College Door Methodology Review,” December 2012, Boulder, Colo.: Western Interstate Commission for Higher Education, accessed 27 July 2020, https://www.wiche.edu/wp-content/uploads/2018/10/methodology.pdf.
[25] William J. Hussar and Tabitha M. Bailey, Projections of Education Statistics to 2028, Washington, D.C.: National Center for Education Statistics, 2020, accessed December 7, 2020, https://nces.ed.gov/pubsearch/pubsinfo.asp?pubid=2020024. These NCES projections are in some groupings similar to WICHE’s projections, and also report mean absolute percentage errors. For example, from the most recent NCES projection report: the mean absolute percentage errors for U.S. public school graduates for lead times of 1, 2, 5, and 10 years were 1.0, 1.1, 2.5, and 5.1 percent, respectively, over nine editions of the projections. And, mean absolute percentage errors of U.S. private school graduates for lead times of 1, 2, 5, and 10 years were 3.0, 2.5, 4.9, and 7.7 percent, respectively, over 17 editions of the projections.
[26] Hussar and Bailey, 2020.
[27] Hussar and Bailey, 2020. NCES projects a high of 3.86 million U.S. graduates with Class of 2026. The NCES projections covered high school enrollments through SY 2016-17, but high school graduates were still projected beginning with Class of 2014. So, the most recent NCES projections did not factor the confirmed graduate counts between class of 2014 and 2019, but are conceivably reflecting much of the effect of graduation increases through the numbers of (retained) high school students.
[28] William J. Hussar and Tabitha M. Bailey, Projections of Education Statistics to 2024, Washington, D.C.: National Center for Education Statistics, September 2016, accessed on November 24, 2020, https://nces.ed.gov/pubs2016/2016013.pdf.
[29] Grawe, 2018.
[30] Stephen Coelen and Joseph B. Berger, “New England 2020: A Forecast of Educational Attainment and Its Implications for the Workforce of New England States,” Center for International Education Faculty Publications, No. 6 (2006), accessed December 7, 2020 from https://scholarworks.umass.edu/cie_faculty_pubs/6/.
[31] Jennifer L. DePaoli, Joanna Hornig Fox, Erin S. Ingram, Mary Maushard, John M Bridgeland, and Robert Balfanz, Building a Grad Nation Report: Progress and Challenge in Ending the High School Dropout Epidemic, Civic Enterprises and America’s Promise Alliance, 2015, accessed December 7, 2020, https://www.americaspromise.org/report/2015-building-grad-nation-report. Lauren Musu-Gillette, Jennifer Robinson, Joel McFarland, Angelina KewalRamani, Anlan Zhang, Sidney Wilkinson-Flicker, Status and Trends in the Education of Racial and Ethnic Groups 2016, National Center for Education Statistics, August 2016, accessed November 24, 2020, https://nces.ed.gov/pubs2016/2016007.pdf.
[32] Bransberger, 2012.
[33] Gretchen Livingston, “5 Facts About Immigrant Mothers and U.S. Fertility Trends,” FacTank News in the Numbers, Pew Research Center, October 26, 2016, accessed November 25, 2020, https://www.pewresearch.org/fact-tank/2016/10/26/5-facts-about-immigrant-mothers-and-u-s-fertility-trends/.
[34] William H. Frey, “U.S. Foreign-Born Gains are Smallest in a Decade, Except in Trump States,” Brookings, October 2, 2019, accessed November 25, 2020, https://www.brookings.edu/blog/the-avenue/2019/10/01/us-foreign-born-gains-are-smallest-in-a-decade-except-in-trump-states/.
[35] Florida Department of Education, “Guidance to School Districts Affected by Hurricane Dorian,” September 5, 2019, accessed November 24, 2020, http://www.fldoe.org/core/fileparse.php/18532/urlt/DorianGuidance.pdf.
[36] Florida Department of Education, “Memorandum: Graduation Requirements for Displaced Puerto Rico High School Students,” December 29, 2017, accessed November 24, 2020, https://info.fldoe.org/docushare/dsweb/Get/Document-8138/DPS-2017-172.pdf.
[37] Fermin Leal, “Uncertain Impact of California’s High School Exit Exam,” EdSource, August 30, 2015, accessed October 18, 2016, https://edsource.org/2015/uncertain-impact-of-californias-high-school-exit-exam/85387.
[38] Theresa Harrington and Louis Freedburg, “California Joins Trend Among States to Abandon High School Exit Exam,” EdSource, October 12, 2017, accessed November 24, 2020, https://edsource.org/2017/california-joins-trend-among-states-to-abandon-high-school-exit-exam/588640.
[39] Education Commission of the States, “50-State Comparison: Dual/ Concurrent Enrollment: Statewide Policy in Place,” April 2019, accessed November 24, 2020, http://ecs.force.com/mbdata/MBQuest2RTanw?Rep=DE1901.
[40] See for example, Community College Research Center, Concurrent Courses Initiative, multiple reports, at https://ccrc.tc.columbia.edu/research-project/concurrent-courses.html; and National Alliance of Concurrent Enrollment Partnerships, “Research on Dual and Concurrent Enrollment Student Outcomes,” multiple reports, http://www.nacep.org/resource-center/.
[41] Colorado Department of Education, “News Release – State’s Graduation Rate Continues to Improve,” January 16, 2019, accessed November 24, 2020, https://www.cde.state.co.us/communications/newsrelease-jan162019graduationdropout.
[42] Matt Barnum, “Nearly a Decade Later, Did the Common Core Work? New Research Offers Clues,” Chalkbeat, April 29, 2019, accessed on November 24, 2020, https://www.chalkbeat.org/2019/4/29/21121004/nearly-a-decade-later-did-the-common-core-work-new-research-offers-clues.
[43] Catherine Gewertz, “Only 16 States Still Share Common-Core Exams, Survey Finds,” Education Week, March 7, 2019, accessed November 24, 2020, https://www.edweek.org/ew/articles/2019/02/27/only-16-states-still-share-common-core-tests.html.
[44] Migration Policy Institute, “Fact Sheet: How Many Unauthorized Immigrants Graduate from U.S. High Schools Annually?”, April 2019, accessed November 24, 2020, https://www.migrationpolicy.org/sites/default/files/publications/UnauthorizedImmigrant-HS-Graduates-FactSheet-Final.pdf.
[45] Elizabeth Redden, “‘They are Americans Now’”, Inside Higher Ed, November 10, 2020, accessed November 24, 2020 at https://www.insidehighered.com/news/2020/11/10/president-elect-biden-has-pledged-reinstate-daca.
[46] Education Commission of the States, “50-State Comparison: States’ School Accountability Systems,” May 31, 2018, accessed November 24, 2020, https://www.ecs.org/50-state-comparison-states-school-accountability-systems/.
[47] Tara García Mathewson, “New Data: Even Within the Same District Some Wealthy Schools Get Millions More Than Poor Ones,” Hechinger Report, October 31, 2020, accessed on November 24, 2020, https://hechingerreport.org/new-data-even-within-the-same-district-some-wealthy-schools-get-millions-more-than-poor-ones/.
[48] Nat Malkus, Richard V. Reeves, and Nathan Joo, The Costs, Opportunities, and Limitations of the Expansion of 529 Education Savings Reports, Washington, D.C.: The Brookings Institute, April 12, 2018, accessed November 24, 2020, https://www.brookings.edu/research/the-costs-opportunities-and-limitations-of-the-expansion-of-529-education-savings-accounts/.
[49] Brian O’Connell, “Here’s a Shocker, Only 30% of Americans Know What a College 529 Plan Is,” The Street, May 31, 2017, accessed November 24, 2020, https://www.thestreet.com/personal-finance/most-americans-don-t-know-about-college-529-plans-14156095.
[50] Mark Dynarski, Is the High School Graduation Rate Really Going Up? Washington, D.C.: The Brookings Institute, May 3, 2018, accessed November 24, 2020, https://www.brookings.edu/research/is-the-high-school-graduation-rate-really-going-up/.