×
The Increasing Nuance in the Racial and Ethnic Identity of U.S. West Youth Populations, 2010-2020

WICHE first summarizes the changes over the last decade that are indicated by the available Census data, about individuals under the age of 18, by the federal classifications used in most aggregated education data for race and ethnicity. Youth populations in the West have declined slightly since 2010, which echoes the projections of high school graduates released by WICHE in December 2020. This decline is concentrated in a handful of states, with many in the WICHE region experiencing growth in the youth population over the last decade. Where there was decline, it was typically driven by fewer single-race non-Hispanic white youth. And in most states, there were more youth who identify as Hispanic or race other than white alone in 2020 than 2010, often partially or wholly offsetting the fewer white youth.
Through these Census data, WICHE also highlights how the racial and ethnic identities of Hispanic youth may not be as monolithic as implied by the category of “Hispanic”, and the varied racial and ethnic identities of the expanding multiracial youth population—nuances that are not as fully described by most aggregated education data such as those used for WICHE’s Knocking at the College Door series of projections of public high school graduates.[2]
This webpage features interactive charts. See data details by hovering or clicking in the charts or open the fully interactive version in a separate window. Or download the dataset of state and county level data.
Youth Population Declines by 2 Percent
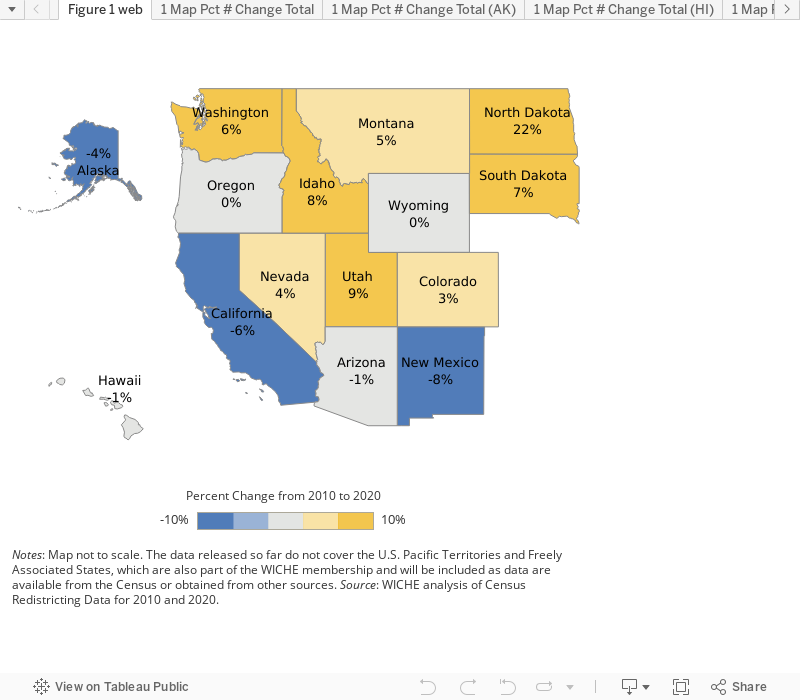
The Census 2020 redistricting population data indicate the beginning of youth population decline that has been predicted by decreases in the numbers of U.S. births since 2007.[3] Nationally, there were 1% fewer individuals under the age of 18 in 2020 compared to 2010. The 15 Western U.S. states saw a combined greater decline of 2 percent (323,200 fewer). This was the result of decreases in youth populations in five Western states over the last decade that ranged from 1% to 8% fewer, and which slightly outweighed the combined increase from the other Western states that had stable numbers or increases that ranged from 3% to 22% (Figure 1).
Figure 1. Percent Change in Individuals Under 18, 2010 to 2020, 15 WICHE States > Interactive chart
The 2020 Census data also confirm further diversification of the U.S. youth population, and the U.S. Western states exemplify this well.
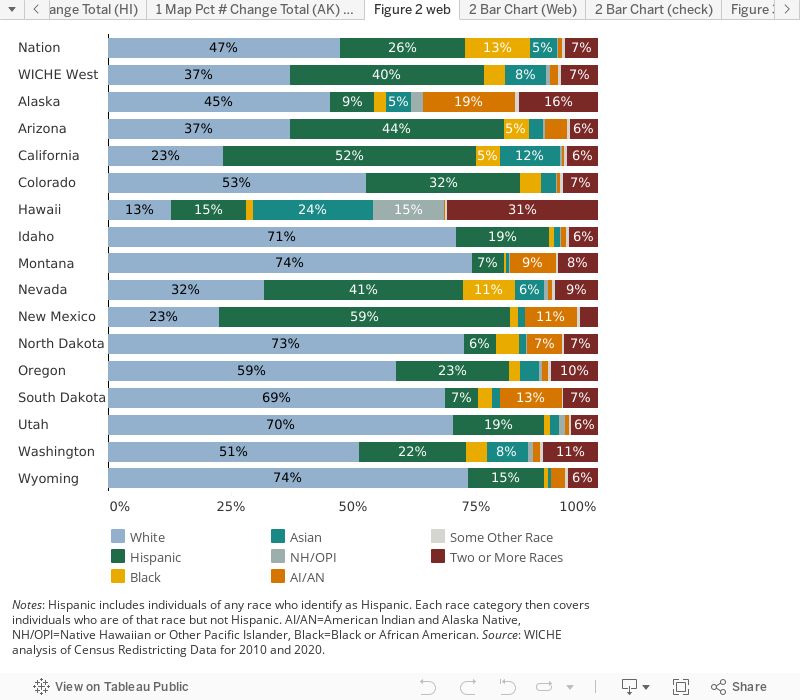
Single-race non-Hispanic white individuals were the overwhelming driver of youth population decrease across the Western states (note: this analysis begins with the single-race non-Hispanic categories, as these are the categories used in most aggregated education data). There were 877,500 fewer single-race non-Hispanic white youth in the West in 2020 compared to 2010, driven by more than a half-million fewer from California (504,700 fewer). Between 2010 and 2020, this segment declined from 41% to 37% of the total youth population in the West.
Only North Dakota and Utah had increases of single-race non-Hispanic white youth over the last decade; decreases across the other Western states averaged 8% (Figure 2).
The data released so far do not cover the U.S. Pacific Territories and Freely Associated States, which are also part of the WICHE membership and will be included as data are available from the Census or obtained from other sources.
Figure 2. Distribution of the Population Under 18 by Race and Ethnicity, 2020 > Interactive chart
In 10 of the Western states, there were increases of single-race non-Hispanic Black or African American youth over the last decade, with an average 26% increase (not including North Dakota, which had more than a 200% increase, from 2,600 to 8,500 single-race non-Hispanic Black or African American youth).[4]
On the other hand, there were 99,000 fewer single-race non-Hispanic Black or African American youth in 2020 than in 2010 from California alone (a 19% decrease), resulting in a 5% decline of single-race non-Hispanic Black or African American youth in the region overall over the last decade.
There were also consistent decreases in the West between 2020 than 2010 of individuals under 18 who identify as single-race non-Hispanic American Indian or Alaska Native, accumulating to a 5% decrease in the region of single-race non-Hispanic American Indian or Alaska Native youth. Eleven Western states had decreases, including five of the eight states that account for 85% of the single-race non-Hispanic American Indian or Alaska Native youth in the West.
On the other hand, Alaska had an increase of 2%, Montana and North Dakota 4%, and South Dakota 1%. However, the single-race non-Hispanic category is particularly likely to understate the American Indian or Alaska Native youth population, as described elsewhere and illustrated in the analysis of multiracial youth below.[5]
Offsets from Growth of Increasingly Diverse Populations
Most states of the U.S. West saw consistent increases over the last decade of single-race non-Hispanic Asian and Native Hawaiian or Other Pacific Islander, Hispanic and multiracial youth.
There was a combined 13% increase of single-race non-Hispanic Asian individuals under 18 across the Western states between 2010 and 2020 (106,500 more), the second largest increase behind multiracial youth. Only two states had decreases of single-race non-Hispanic Asian youth over the last decade: Alaska had 4% fewer and Hawaii, which still has the third-largest number of single-race non-Hispanic Asian youth in the West, had 7% fewer. The thirteen other Western states all had increases, averaging 23% (excluding North Dakota, which had a 218% increase, from 70 in 2010 to 230 in 2020).
Single-race non-Hispanic Native Hawaiian or Other Pacific Islander youth increased 18% in the West between 2010 and 2020 (19,900 more), resulting from increases in all but California (and excluding New Mexico, which had virtually the same number over the last decade). The Western state with the second-highest number of single-race non-Hispanic Native Hawaiian or Other Pacific Islander youth after Hawaii – California – experienced a 10% decrease in its numbers between 2010 and 2020. Single-race non-Hispanic Native Hawaiian or Other Pacific Islander youth in Hawaii increased by 17%, Washington 55%, and Utah 35%. The other 10 states with relatively smaller populations all experienced increases, averaging 58%.
There were 1% fewer Hispanic youth in the West in 2020, decreasing from 7.20 million in 2010 to 7.12 million in 2020. The Hispanic share of youth overall held steady between 2010 and 2020 (39% and 40%, respectively). The 1% overall regional decrease was driven by 5% fewer Hispanic youth in California in 2020 compared to 2010 (259,900 fewer) and 6% fewer in New Mexico (18,000 fewer). On the other hand, there was an average 21% increase of Hispanic youth in 10 states over the last decade, in which increased numbers of Hispanic youth contributed strongly to net youth population increase; the greatest increase was 119% in North Dakota, and Hawaii and Arizona had steady numbers.
Greater Detail About Western Diversity from the Census Data
The Census data provide more detail about the layers of identity and the combinations of ethnicity and race of many individuals who are included in aggregated education data categories of Hispanic and multiracial. In addition, Census allows for individuals to specify “some other race” if they do not identify with the provided race categories.
Racial Identities of Hispanic Youth. The Census data illustrate that the racial and ethnic identities of Hispanic youth in the U.S. West may not be as monolithic as the single category of “Hispanic,” which is the only way that Hispanic students are represented in aggregated education data. The lines between race and ethnicity are particularly blurred for this population. In 2010, 46% of Hispanic youth in the West were white, by race, and this was the largest racial category for Hispanic youth. By 2020, 21% of the West’s Hispanic youth were white, and youth of “some other race” or who were multiracial became the largest pluralities among Hispanic youth; 44% and 30%, respectively (Figure 3). The categories of “some other race” and multiracial are discussed in turn below.
Figure 3. Racial Composition of Hispanic Population Under 18, Census 2020 > Interactive chart
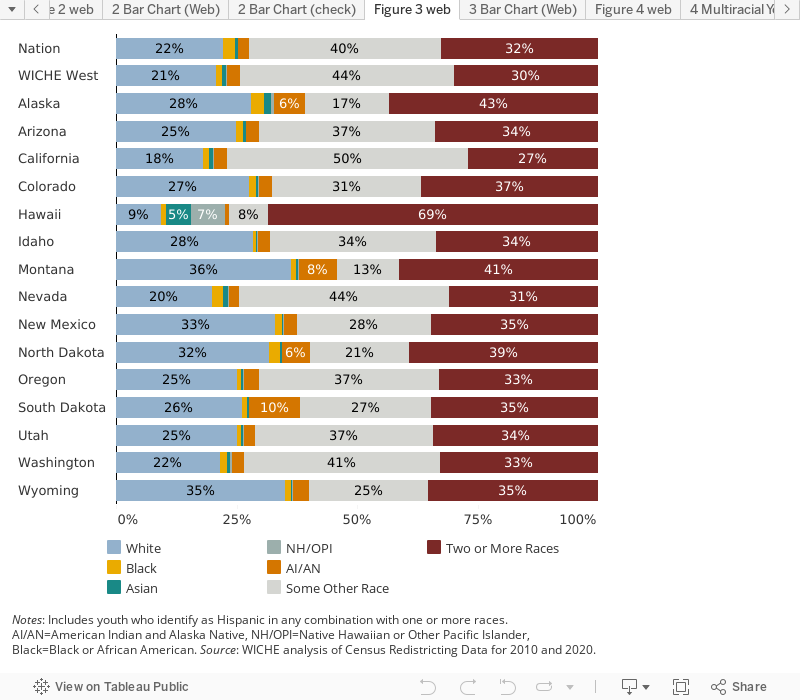
The “some other race” category has been available in the Census since at least 1910 and is available for individuals who choose to not identify as American Indian or Alaska Native, Asian, Black or African American, Native Hawaiian or Other Pacific Islander, or white.[6] (To avoid confusion with a more generic meaning, the category of “some other race” is indicated throughout in quotation marks.) Whereas only 1% of non-Hispanic youth across the Western states identify as “some other race,” 40% of the West’s Hispanic youth identify as “some other race,” with similarly high proportions by state.[7] And, among the Hispanic youth included in the multiracial category, 75% identified as white and “some other race” in 2020.[8]
Selecting “some other race” as a racial category has many meanings for both Hispanic and non-Hispanic individuals. The high incidence of Hispanic youth being “some other race” may reflect overall Hispanic uncertainty about how to answer the race question on the Census form, the multidimensional and multifaceted ways Hispanic individuals identify themselves, and/or the Census Bureau’s changes for Census 2020 to how race and ethnicity were asked about and coded.[9]
When this large portion of Hispanic youth who identify as white and “some other race” are included in the multiracial total, the multiracial youth population in the West increased almost 130%, from 1.5 million in 2010 to 3.5 million in 2020.
More Detail About Youth Who Identify as Multiracial. The racial identity of Hispanic individuals is available in the Census data, but not aggregated education data. So, the large portion of the U.S. West multiracial youth population that is Hispanic identifying as white and “some other race” is removed from the analysis, in order to learn more from the Census data about youth in the multiracial category.[10]
The number of multiracial youth in the West increased 51% between 2010 and 2020, from 1.2 million to 1.9 million. Figure 4 charts these multiracial youth by combinations of race and ethnicity. Detail by year, state and for more specific populations is available in the interactive chart.
Figure 4. Multiracial Youth in the West, 2020 > Interactive chart
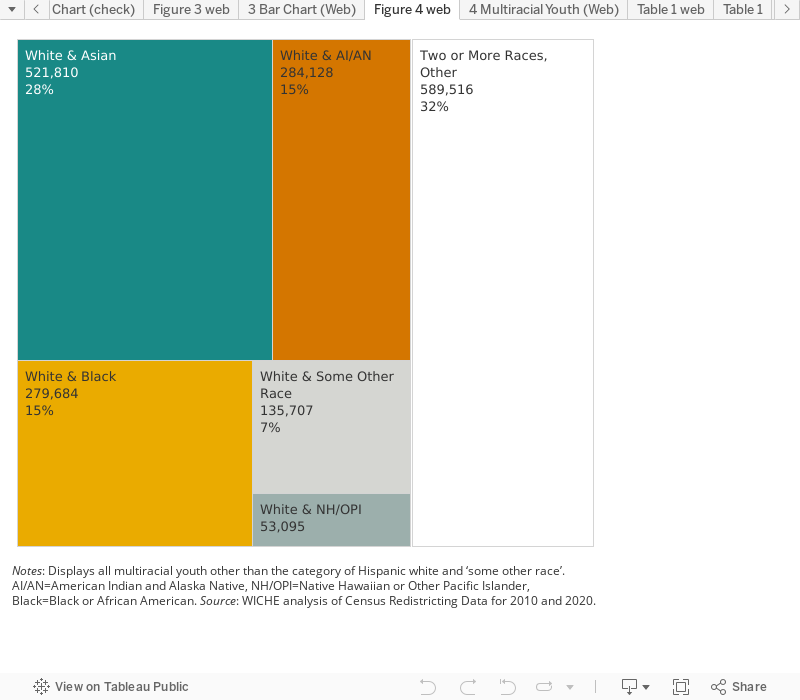
More than 80% of multiracial youth in the U.S. West identify with two races; almost 70% identify as white in combination with one other of the five race categories available for selection. Youth identifying as white and Asian led the increase among youth of two races (141,100 more in 2010 than 2020, 37% increase), followed by youth identifying as white and “some other race” (123,100 more, ten-fold increase);[11] white and American Indian or Alaska Native (117,500 more, 71% increase); white and Black or African American (45,800 more, 20% increase); white and Native Hawaiian or Other Pacific Islander (7,400 more, 16% increase).
The remaining one-third of the U.S. West multiracial youth population—multiracial youth who identify as a race other than white in combination with one other race—increased 48% from 398,400 in 2010 to 589,500 in 2020. These more than a half-million children represent a wide range of racial and ethnic identities that vary quite a bit by state, as can be explored in the interactive version of Figure 4.
Some Populations That Appear in Decline, Are Increasing By Broader Race Definitions. The growth in the two or more races category also has important implications for understanding and interpreting demographic data on some populations that would appear to be decreasing according to the single-race non-Hispanic definition. But which have, in fact, increased in number when those who identify with multiple races are included.
As one example, there were 316,700 single-race non-Hispanic American Indian or Alaska Native youth across the Western states in 2020, a decline of 5% since 2010 by the non-Hispanic single-race definition. The number more than doubles to 823,700 when including any youth who identify as American Indian or Alaska Native alone or in combination with another race or ethnicity, which would be an increase of 33% of American Indian or Alaska Native youth in the region overall rather than a 5% decrease. The rate at which American Indian or Alaska Native youth in the West identified with multiple races or as Hispanic increased between 2010 and 2020.
Similarly, by the single-race non-Hispanic definition, there was a 5% decrease in the U.S. West of Black or African American youth from 2010 to 2020 (43,500 fewer, to 771,100 in 2020). But when youth who identify as Black or African American alone or in combination with another race or ethnicity are considered, the number of Black or African American youth increases by 70%, to 1.3 million in 2020, indicating there was an increase of 6% instead of 5% decrease. And the rate at which Black or African American youth in the West identified with multiple races or as Hispanic increased between 2010 and 2020.
Conclusions and Discussion
These data are the first look at information from the 2020 Census and reinforce other research and data about the increasing diversity of the populations that will make up future postsecondary students. As more information from the latest census becomes available, WICHE will continue to examine the implications for postsecondary education in the West. Based on this initial analysis, there are several important ideas for postsecondary leaders and policymakers in the West to consider, including:
- The Census data reinforce the overall declines that have been occurring in the pipeline of youth. But the topline view—which often largely reflects the numerically greater decreases of single-race non-Hispanic white youth—can mask the presence of increasing numbers of children of color.
- Planners and policymakers will need to consider a range of data as they seek to understand and serve rapidly diversifying populations. Any data about race or ethnicity reflect reporting categories and may not fully capture an individual’s lived experience, nuanced identities, or breadth of heritage. But the detail in Census data reveals nuance and an expanding “medley of diversity” among school-age youth that is somewhat obscured in aggregated education data. And, importantly, some data may even be misleading about the trends for some populations, such as the tendency for aggregated students counts to depict declines in the American Indian or Alaska Native youth population (among others).
- Youth population decline and diversification should propel education systems to successfully serve a wider variety of individuals, including students of color and adults, in order for states to sustain higher education systems, workforces and economies. As student groups who have been poorly served by higher education continue to increase as a percentage of the total, if equity gaps are not addressed, one might even expect average educational attainment, economic well-being and other indicators to trend downward.
- Demographic trends in the Pacific region are relevant for U.S. West higher education, but data availability remains limited. Every effort should be made to extend coverage of these jurisdictions to data resources such as these, and WICHE will report about the U.S. Pacific Territories and Freely Associated States as data are available from the Census or obtained from other sources.
Data Notes
Table 1 illustrates the groupings of race and ethnicity available from the Census redistricting data, including the categories typically used in aggregated education data.
Table 1. Race and Ethnicity of Youth Under 18 in the West, U.S. Census, 2020 > Interactive chart
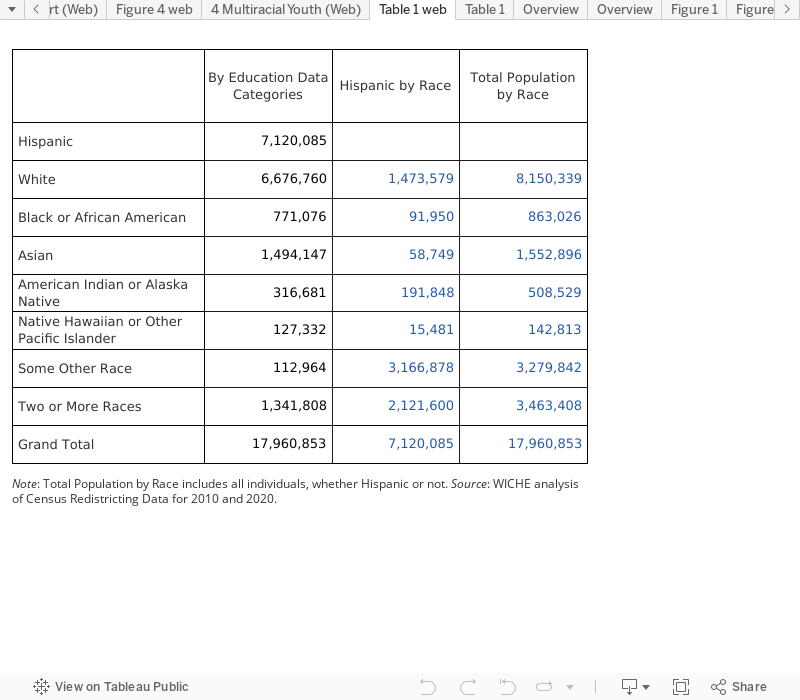
Education data are typically collected and stored by the two-question format, with the Hispanic ethnicity question first, followed by the question allowing selection of one or more of five racial groups. But aggregate student counts are reported as: Hispanic of any race, single-race non-Hispanic categories, or two or more races.
All data used in this analysis are the 2010 and 2020 Census redistricting data as compiled by WICHE.
The number of Hispanic individuals in combination with one or more races were computed by subtracting the count of non-Hispanic individuals of each race or race combination, from the total population of individuals by race or race combination.[12] And the number of individuals under 18 years of age (“youth”) were computed by subtracting the population 18 years and over from the total population, at each level of detail. Only these two main categorizations of the population by age are available at this time; more specific age data are not yet available.
It is important to note that the data likely reflect actual demographic changes in the population over the past 10 years as well as improvements to the question designs, data processing and coding.
Endnotes
[1] The U.S. Census Bureau has released the 2020 redistricting data that describe the U.S. population, and visualizations including state population change profiles for the last decade. Many state population data centers also provide compiled datasets and analysis for their state. And on September 16, the Census Bureau made more detailed statistics available on data.census.gov. Throughout, the “West” and “Western states” encompass 15 WICHE member states (see Figure 1); the data released so far do not cover the U.S. Pacific Territories and Freely Associated States, which are also part of the WICHE membership. WICHE intends to include the U.S. Pacific Territories and Freely Associated States as data become available from the Census or other data sources.
[2] See National Center for Education Statistics, Statistical Standards: Standard 1-5 Defining Race and Ethnicity Data, at https://nces.ed.gov/statprog/2002/std1_5.asp. It is important to note that increase or decrease in certain race or ethnicity categories will reflect both actual population changes (e.g., birth rates and differences between populations and migration, between states and in or out of the US), and some may be the result of Census questionnaire and data coding changes.
[3] See Western Interstate Commission for Higher Education, Knocking at the College Door Projections of High School Graduates, December 2020, at https://knocking.wiche.edu/report/.
[4] North Dakota had the fourth-highest growth rate in the nation by percentage, growing by 15.8% from 2010 to 2020: “ND sees record high population in newly released 2020 Census data, 4th highest growth rate by percentage,” North Dakota state website, April 26, 2021, at https://www.nd.gov/news/nd-sees-record-high-population-newly-released-2020-census-data-4th-highest-growth-rate. Public school Black/African American 1st to 12th graders in North Dakota increased 150% from school year 2009-10 to 2019-20: WICHE analysis of Common Core of Data, available from https://nces.ed.gov/ccd/.
[5] Colleen Falkenstern and Angie Rochat, “Better Data for Supporting American Indian/Alaska Native Students,” Western Interstate Commission for Higher Education, February 2021, at https://www.wiche.edu/wp-content/uploads/2021/02/BetterDataforSupportingAIANStudents.pdf.
[6] Anna Brown, “The changing categories the U.S. census has used to measure race,” Pew Research Center, February 25, 2020, at https://www.pewresearch.org/fact-tank/2020/02/25/the-changing-categories-the-u-s-has-used-to-measure-race/. Youth who identify as ‘some other race’ increased from 2010 to 2020; the patterns likely reflect actual demographic changes in the population over the past 10 years as well as improvements to the question designs, data processing and coding. Note: Youth identifying as “some other race” in Census data are spread across the Hispanic and race categories in education data.
[7] The 1% increases to 2% when non-Hispanic multiracial youth having “some other race” identity are included. There was relatively little change in the percentage of Hispanic youth who identify as some other race between Census 2010 and 2020. Only the Western states that have experienced the greatest rates of diversification on relatively homogenous populations saw strong changes in this category (Montana 31% increase, North Dakota 158%, and South Dakota 78%).
[8] Hispanic multiracial youth who identify as white and “some other race” accounted for 63% of all youth whose identity includes “some other race” in the West; 79% of all multiracial youth whose identity includes “some other race” (Hispanic or non-Hispanic); and 46% of all multiracial youth in the West (Hispanic or non-Hispanic).
[9] For a discussion of Hispanic racial identify, see for example: Kim Parker, Juliana Menasce Horowitz, Rich Morin, and Mark Hugo Lopez, “Multiracial in America, Chapter 7: The Many Dimensions of Hispanic Racial Identity,” Pew Research Center, June 11, 2015, at https://www.pewresearch.org/social-trends/2015/06/11/chapter-7-the-many-dimensions-of-hispanic-racial-identity/. Gene Demby, “On The Census, Who Checks ‘Hispanic,’ Who Checks ‘White,’ And Why,” NPR, June 16, 2014, at https://www.npr.org/sections/codeswitch/2014/06/16/321819185/on-the-census-who-checks-hispanic-who-checks-white-and-why. Sonja Tafoya, “Shades of Belonging,” Pew Hispanic Center, December 6, 2004, at https://www.pewresearch.org/wp-content/uploads/sites/5/reports/35.pdf. Mike Schneider, “Census shows US is diversifying, white population shrinking,” APNews, August 12, 2021, at https://apnews.com/article/census-2020-house-elections-4ee80e72846c151aa41a808b06d975ea.
[10] The vast majority of all multiracial youth in the U.S. West other than Hispanic youth who are white and “some other race,” are non-Hispanic (83%). Hispanic multiracial youth who are not in the category of white and “some other race” are retained for this analysis, because some populations such as American Indian or Alaska Native identify as Hispanic at relatively high rates.
[11] As discussed elsewhere, Hispanics have a high incidence of identifying as “some other race” than provided by the main race categories; this increase therefore may include Hispanic whites. But there are other populations who also do not identify with the main racial categories provided in the Census. See for example, Hansi Lo Wang, “The Census Has Revealed A More Multiracial U.S. One Reason? Cheaper DNA Tests,” NPR, August 28, 2021, at https://www.npr.org/2021/08/28/1030139666/2020-census-results-data-race-multiracial-dna-ancestry-test-mixed-biracial.
[12] On August 24, 2021, WICHE staff confirmed with the Colorado state Census data lead that these are appropriate computations from the data. Datasets with greater Hispanic detail are expected to be released in March 2022. Note: individuals who declined or did not indicate their Hispanic origin or race (i.e., no response or unknown race) are categorized into the available categories during Census data processing.